How to profile Go applications inside a docker container
By Jan Pieter Bruins Slot • Published December 12, 2019
#golang #docker #profiling #debugging
Introduction
In this post I’ll give a quick overview of several methods you can use for
profiling/debugging Go applications that are running in a docker container. To
get a more in-depth overview of the several methods, I’ve added the source
links you can reference at the end of the post. I really advise you to read
the sources listed, and read up on how to use and interpret the created
profiles in order to debug/optimize your application. This post aims to help
you to create those profiles when using a Docker container to run your Go
applications. The main idea is that we are going to leverage the remote
profiling capabilities that is supplied by the net/http package.
Application
We will be using pprof to profile your Go applications, you’ll typically use
pprof when you’re able to access the binary of your application locally. When
you’re using a docker container you’d need to have the go tool installed in
the container to be able to profile it. However there is another way for
profiling Go applications running in a docker container. For this we need to
create an HTTP webserver, which will enable the pprof HTTP endpoints. From
these endpoints we’re able to download profiles of the running application.
So first we need to create an HTTP webserver, that we will run in a goroutine.
We can then import the net/http/pprof package, which automatically enables
the pprof HTTP endpoints of the webserver we’ve created, and it will install
the handlers under the http://localhost:6060/debug/pprof URL.
So we can add the following to our code:
// main.go
package main

import (
	"fmt"
	"math/rand"
	"net/http"
	_ "net/http/pprof"
)

func main() {

    // Add the following
    go func() {
        http.ListenAndServe(":6060", nil)
    }()

    // Some sample code
    for {
        n := rand.Intn(10) + 1
        fmt.Printf("Fibonacci sequence for %d:\n", n)
        for i := 1; i <= n; i++ {
            fmt.Println(fibonacci(i))
        }
    }
}

func fibonacci(n int) int {
	if n < 2 {
		return n
	}
	return fibonacci(n-1) + fibonacci(n-2)
}
When you are using a different router, we can do the following to make the
pprof HTTP endpoints work. Below is an example how you would do this if
you’re using gorilla/mux
// main.go
package main

import (
    _ "net/http/pprof"
    _ "expvar"
    "github.com/gorilla/mux"
)

func main() {
    router := mux.NewRouter()

    router.HandleFunc(
        "/debug/pprof/", pprof.Index,
    )
    router.HandleFunc(
        "/debug/pprof/cmdline", pprof.Cmdline,
    )
    router.HandleFunc(
        "/debug/pprof/profile", pprof.Profile,
    )
    router.HandleFunc(
        "/debug/pprof/symbol", pprof.Symbol,
    )
    router.HandleFunc(
        "/debug/pprof/trace", pprof.Trace,
    )
    router.Handle(
        "/debug/pprof/goroutine", pprof.Handler("goroutine"),
    )
    router.Handle(
        "/debug/pprof/heap", pprof.Handler("heap"),
    )
    router.Handle(
        "/debug/pprof/threadcreate", pprof.Handler("threadcreate"),
    )
    router.Handle(
        "/debug/pprof/block", pprof.Handler("block"),
    )
    router.Handle(
        "/debug/vars", http.DefaultServeMux,
    )

    http.ListenAndServe(":6060", router)
}
Docker
For the docker container we’ll create the following Dockerfile:
# Dockerfile
FROM golang:1.13

WORKDIR /go/src/app
COPY . .

RUN go get -d -v ./...
RUN go install -v ./...

CMD ["app"]
Next, we can build and start our Docker container:
$ docker build -t pprof-app .
$ docker run -p 6060:6060 -it --rm --name my-running-app pprof-app
Once you’ve updated the files you’ll be able to access the endpoints by using
your browser and to go to
http://localhost:6060/debug/pprof/, or you can
use go tool pprof. We’ll explore a few of the methods we can profile the
application using go tool pprof
pprof
Now, that we’ve set everything up to use pprof, we’ll profile our application
for cpu, and heap. Additionally we’ll also trace the application.
CPU
When we want to start to profile our application to determine where an application spends time, we first need to make a CPU profile. And we have several methods to do so. Below I’ll give the common ones. The gist of it is that we’re fetching the profile over HTTP, on the endpoints that we’ve created in our application.
-
Go to http://localhost:6060/debug/pprof/profile, and after 30 seconds you’ll automatically download the profile, or
-
Use
go tool pprof. It will tell you where the profile is being stored, and will open up an interactive terminal that you can use to interpret the results. Like so:go tool pprof http://localhost:6060/debug/pprof/profile
After that we can interpret the results, and for this we again have several options, and tools we can use to interpret the results You can read more about additional ways to interpret the results at the sites I’ve listed in the “Sources” section at the end of the post.
Here I’ll show you a few of them. One of them is that we’re able to inspect the results in an automatically created web interface.
$ go tool pprof -http=":8080" [path-to-profile-dump]
This will open up a webbrowser, in which we can inspect, for instance, the flamegraph of the created profile.
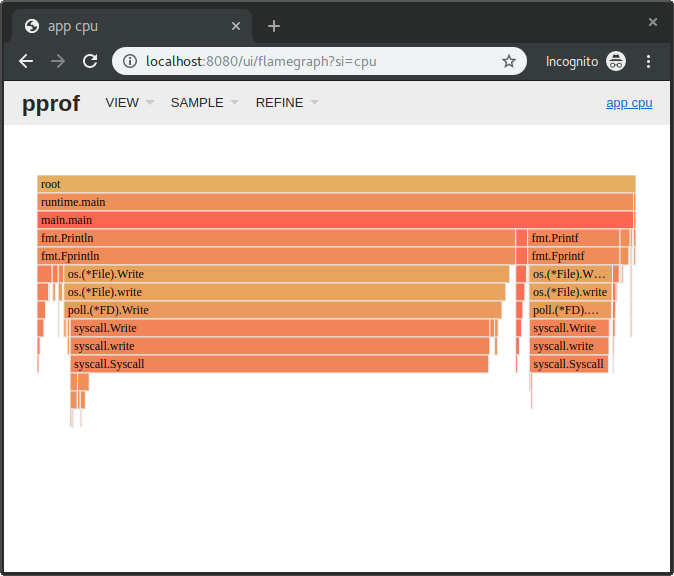
The horizontal axis represents the total number of samples collected. So the larger the area, the more time has been spent executing the associated function. The vertical axis represents the depth of the call stack. So the higher the peak, the deeper the call stack. Colors don’t represent anything specific; they’re just there to make a visual contrast.1
Another method is that we can use the command line based interactive interface
by using the go tool:
$ go tool pprof [path-to-profile-dump]
We can also instantly go to the web interface, and step over the whole download profile step, by using the following command:
$ go tool pprof -http=":8080" http://localhost:6060/debug/pprof/profile
One thing to remember is: if you’re making cpu profiles that takes a certain
amount of time you need to specify that your server is able to handle those
long request times. You typically want to add the following to your
http.Server:
srv := &http.Server{
    WriteTimeout: 30 * time.Second,
}
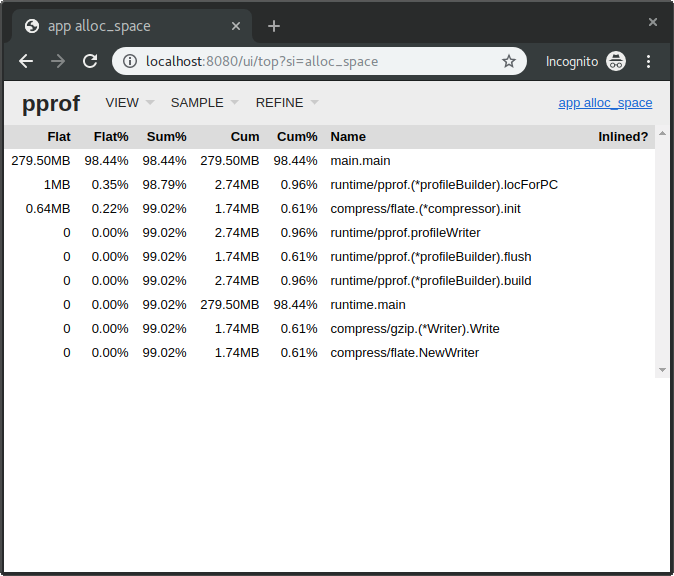
Heap
In order to get a heap profile, so that we can inspect the memory usage of the application, we again can issue the following commands:
-
Go to http://localhost:6060/debug/pprof/heap, and we will automatically download the heap profile, or
-
Using the
go tool, it will tell you were the profile is being stored, and it opens up an interactive terminal that you can use to interpret the results:
# Heap profile
#
# optional flags:
#   –alloc_space tells you how many megabytes have been allocated.
#   –inuse_space tells you know how many are still in use.
$ go tool pprof http://localhost:6060/debug/pprof/heap
And, just like with the CPU profile, we’re able to interpret it with go tool pprof, and the web interface:
# Go tool
$ go tool pprof [path-to-profile-dump]

# Web interface
$ go tool pprof -http=":8080" [path-to-profile-dump]

# Create profile and start web interface
$ go tool pprof -http=":8080" http://localhost:6060/debug/pprof/heap
Trace
To trace the runtime activities/events of an application, we can do the
following. First, we need to download the trace file, and we can use curl for
this. Specify for how many seconds you want to create a trace and make sure to
create some load in that time frame. Once downloaded you can use the go tool
to start up a web interface in which you can inspect the results.
The trace tool will capture execution events like the creation, blocking, unblocking of goroutines, garbage collection events, processor starting and stopping, enter, exit, and block syscalls.2
Issue the following commands:
$ curl http://localhost:6060/debug/pprof/trace?seconds=20 > trace.out
$ go tool trace trace.out
This will open up your webbrowser, and you’ll be able to interpret the results of your trace with the provided web interface.
Conclusion
We’ve explored some methods that allows us to profile our Go applications when it is run in a Docker container. There’s a lot more information out there, that can help you optimize your applications using these methods. I’ve listed several of those below in the “Sources” section. Be sure to check them out they have some great additional information that can help you.
Sources
- golang.org: Diagnostics
- golang.org: Package runtime/pprof
- golang.org: Package net/http/pprof
- golang.org: Profiling go programs
- github.com: Go tool pprof
- Julia Evans: Profiling Go with pprof
- Jimmy-Xu: pprof in docker daemon
- Rhys Hiltner: An introduction to go tool trace
- Rhys Hiltner: Go’s execution tracer (youtube)
- Svet Ralchev: Performance and memory analysis of Golang programs
- Brad Fritzpatrick: Profiling & Optimizing in Go
- Will Sewell: go tool trace