How to profile Python applications inside a docker container
By Jan Pieter Bruins Slot • Published November 21, 2019
#python #docker #profiling #debugging
In the following post I’ll explain how you can profile a running Python program
in a Docker container using py-spy. py-spy
is able to generate flame graphs,
and it can give us profiling capabilities in order to debug our Python programs.
Now, when your Python code is running in a Docker container it can be a bit
more difficult to profile your code, and this post sets out to show you how
this can be done with these tools.
1. Setting up
Before we can profile the Python application, we need to set up the tools, and example files, that we will be using in this project. You can inspect the finished result here.
1.1 Project
Let’s get started with the project outline, and create the following files and
folders, the docker-compose.yml is optional because I will show you how to
use plain docker as well.
$ tree -L 1 --dirsfirst
.
├── app/
├── pyspy/
└── docker-compose.yml
1.2 py-spy
In the pyspy/ folder we will be creating a Dockerfile that we’re going to
use to create a Docker container that contains the py-spy program. The
Dockerfile should contain the following:
# pyspy/Dockerfile
FROM python:3.6
RUN pip install py-spy
WORKDIR /profiles
ENTRYPOINT [ "py-spy" ]
CMD []
Let’s test if is is working:
$ cd pyspy/
$ docker build -t pyspy .
$ docker run -it pyspy

py-spy 0.3.0
Sampling profiler for Python programs

USAGE:
    py-spy <SUBCOMMAND>

OPTIONS:
    -h, --help       Prints help information
    -V, --version    Prints version information

SUBCOMMANDS:
    record    Records stack trace information to a flamegraph, speedscope
              or raw file
    top       Displays a top like view of functions consuming CPU
    dump      Dumps stack traces for a target program to stdout
    help      Prints this message or the help of the given subcommand(s)
Cool, that worked! Now, you’re also able to install py-spy locally on your
host system. When you do, be sure to read the documentation at:
https://github.com/benfred/py-spy, on how to do this.
1.3 Python
Next, we want to create a Python program that we will use to profile. Create
a new file in the app/ folder name run.py and copy the contents into it.
# app/run.py
import random


def factorial(n):
    factorial = 1
    for i in range(1, n + 1):
        factorial *= i

    return factorial


if __name__ == "__main__":
    while True:
        n = random.choice(range(1, 5))
        f = factorial(n=n)

        print("Factorial of {n} is {f}".format(n=n, f=f))
Next, create a Dockerfile in the app/ folder:
# app/Dockerfile
FROM python:3.6
WORKDIR /usr/src/app
COPY run.py .
CMD [ "python", "./run.py" ]
And again, let’s see if it is working:
$ cd app/
$ docker build -t app .
$ docker run -t app
Press Control-C to exit the program.
1.4 Docker Compose
I promised that I’ll show you how to also use Docker Compose to orchestrate our
containers. Create docker-compose.yml file and add the following to it:
# docker-compose.yml
version: "3"
services:
  pyspy:
    build:
      context: pyspy/
    pid: "host"
    privileged: "true"
    volumes:
      - .:/profiles

  app:
    build:
      context: app/
    cap_add:
      - sys_ptrace
Now, we can build the containers like so:
$ docker-compose build
You’ll probably wondering about what the pid, privileged and cap_add is
used for, and I’ll get to that in the next section.
2. Profiling the program
We’ve set everything up and we’re ready to test everything. First, let’s run
the python program. We need to add --cap-add sys_ptrace, because by default
Docker images do not have the SYS_PTRACE capability. And this is because
Docker is restricting the process_vm_readv system call that py-spy uses to
directly read the memory of the Python program.
# docker
$ docker run --cap-add sys_ptrace -t app --name py-app

# docker-compose
$ docker-compose up app
Now, before we’re able to use the py-spy program, we need to get the PID of
the Python program that is running in the container. We will be using the PID
of the program, and py-spy is going to sample from it.
# docker
$ docker inspect --format '{{.State.Pid}}' py-app
26982

# docker-compose
$ docker inspect --format '{{.State.Pid}}' profile-python-docker_app_1
26982
Now, that we’ve got the PID we will be using it with py-spy to profile
our Python application. Now that we’re using the PID of the running program
in the Docker container. We need the py-spy container to be able to use
this PID inside it’s container. So we to use the host’s PID namespace
inside this container, and we do that by adding the flag --pid=host to
the run command. Additionally, we need to add the --privileged flag,
so that it allows the container the same access to the host as processes
running outside containers on the host.
# docker: change $(pwd) where you want the profiles to be saved
$ docker run \
    --pid=host \
    --privileged \
    -v $(pwd):/profiles \
    -it pyspy record -o myprofile.svg --pid 26982

# docker-compose
$ docker-compose run pyspy record -o myprofile.svg --pid 26982
You can now open the myprofile.svg file with a browser and look at the
flamegraph that was created, and you’ll be able to interpret the results.
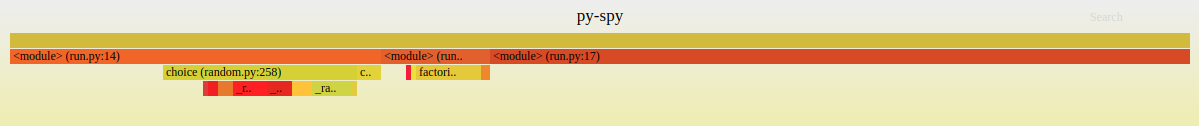
The horizontal axis represents the total number of samples collected. So the larger the area, the more time has been spent executing the associated function. The vertical axis represents the depth of the call stack. So the higher the peak, the deeper the call stack. Colors don’t represent anything specific; they’re just there to make a visual contrast. (source)
A cool feature of py-spy is that we can also create our profiles in the
speedscope and inspect it with the online tool.
Add the --format speedscope flag to the command and you’ll be able to import
the profile in the speedscope format.
Conclusion
Now, you’ve got a basic setup to profile your Python applications in a Docker
container. So, be sure to read up on all the features and options of
py-spy so that you can fully utilize it
and, profile your Python applications in Docker containers.